Last week, my article, "Increase in Volatility Ahead," told readers to expect an increase in stock market volatility over the coming weeks. It also warned about a looming bear market, as more and more stocks have suffered significant price declines over the past couple of months.
Volatility has in fact increased considerably over the past few days and investors have become more uncertain about the future direction of stock prices.
But, rather than listening to all of the "experts" on CNBC, there is a much simpler way for you to monitor your stock market investments and determine when there might be a smart time to exit the markets — by using some simple "technical" analysis. Yes, I mentioned that ugly word that academic theorists, economists, and Wall Street "experts" tend to disregard.
Although I consider myself to be, primarily, a fundamental analyst, I have always used charts to stay abreast of what is actually happening in the markets, as opposed to what I (and other experts) expect to happen. And, as you can see by reviewing the charts below, some simple forms of technical analysis can be very helpful in determining when to get out of stocks.
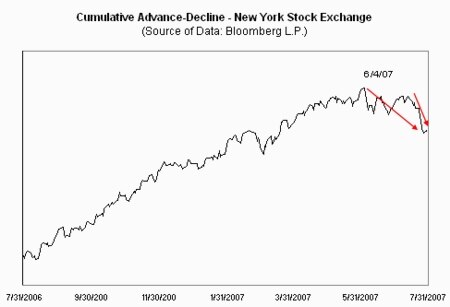
The first chart shows the number stocks listed on the New York Stock Exchange that have been advancing in price less those that have been declining. This simple chart of the Advance-Decline Line reached a high point on June 4, topping out more than a month before the major stock market indices witnessed their biggest two-day decline (last week) since March 2003.
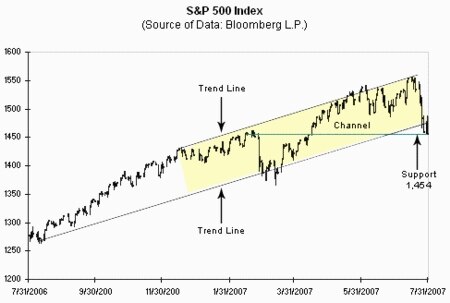
The second chart identifies a key price-support level (at 1,454) for the S&P 500 Index and illustrates how stock prices tend to trade within a certain "channel" for prolonged periods of time — the yellow-highlighted area between the two upward-trending trend lines. You can generally feel secure about a stock investment as long as it holds up above a price-support level and trades within a "channel". But, you should start to monitor your stock holdings very closely whenever they break down below a major price-support level and trade outside of their channel area.
As you can see in the chart below, the S&P 500 Index closed on Tuesday of this week right at a price-support level. However, earlier today it broke down through that level and traded as low as 1,443. Hence, you should probably start to monitor your stock investments a little closer.
But, please note that I am not suggesting for you to sell your stocks. Rather, I am merely trying to show you a simple way to monitor the stock market.
All of us have our own individual investment goals and many investors prefer to stay at least partially invested in the stock market at all times.
© 2026 Newsmax. All rights reserved.